The myth of the panicky individual investor
March 14, 2020
In early 2009 I had one of the most exciting weekends of my professional life.
Over the course of the financial crisis I was granted access to the database of the UK’s largest self-directed brokerage. A kid in a candy store had nothing on me. Oh, the behavioral biases I would document, the negative alpha I would discover!

I did find poorly constructed and undiversified portfolios. Some had just five similar stocks; others had extreme allocations of 0% stocks and 100% stocks. There were dividend chasing portfolios and currency gambles. And there were day traders who paid the bid-ask spread a lot, and a lot of portfolios with heavy home bias.
But one big stereotype wasn’t there: broad based panic-selling.
The self-directed traders tended to, if anything, buy on dips and let their cash accumulate after rallies. On average, they tended to do what you’d think a good investor would do, in terms of high-level market timing. They bought relatively low and sold relatively high. They made mistakes, sure. And some of them definitely did try to time the market–and did so poorly. But it wasn’t the majority.
So where did the stereotype of the panicky retail investor come from?
A recipe for believing everyone is sick
Required Ingredients:
- A market drop, ideally with a clear narrative.
- Reporters looking for quotes from people on the ground and real-life examples of how people are reacting.
- Financial advisors slightly too eager to respond to calls from reporters and talk about their work
Directions:
Step 1:
- Crack open the “correction” or “bear market,” ideally when it passes a magical round number like -10% or 1000 points.
- Give reporters coffee and deadlines. Tell them to get quotes.
- Self-directed investors who want to talk to the media will probably be hard to source. Use a convenient substitute: financial advisors.
Step 2:
- Call the advisors; ask them what their clients are doing.
- Advisors will probably talk about the most interesting parts of their days: the calls with clients who need to be talked off the ledge. The visceral, remarkable, salient ones.
Step 3:
- Extrapolate from that small-yet-sensational advised sample to most investors.
Notice: No one is being malicious or deceptive. This is garden-variety sample bias amplified over and over by a focus on action or the unusual.
Imagine if reporters called doctors to see if people are sick - “well, everyone I see is!” Most investors don’t have an advisor. Those that do probably chose to because they’ll get more benefit from them.
Advisors aren’t lying. All the clients who do call in during a crisis are top of mind. We talk about what’s happening, not what isn’t happening ( 👋Abraham Wald).
Inaction doesn’t show up in the denominator. When we look at things like the balance of buys and sells, we’ve implicitly excluded those who do nothing – and who might in fact be the vast majority.
And voila, a stereotype that most non-professional investors are reactive, panicky, and easily swayed by the news.
What actually happens
What really happens when stocks have tumbled? In my estimation, most people do nothing. And those that do take action typically aren’t making extreme decisions.
Now, these are my perceptions – some of which are based on data I can’t share, and some of which are based on the articles cited below. In contrast to the way an anecdotal story comes about, my views are based on impersonal data: I can query databases and see what thousands of people are doing on average, but I can’t tell you about how Bob called in crying and I managed to counsel him to fortitude. And, to be fair, my perceptions are biased by the data I look at and the questions I choose to ask of that data. Caveat lector.
Why do most people do nothing? The vast majority of people aren’t that interested in the stock market, per se. This is especially true in retirement accounts like IRAs and 401(k)s, where a mental framing of the account as a vehicle for long-term growth that shouldn’t be touched until retirement is strong. These things are on auto-pilot and have mechanisms like auto-deposit and glide down, but there are no active decisions required from the account owners. That means investors can ostrich and not log in to their accounts.
One solid reference is a study of Vanguard IRA accounts 2008-2013: About 1 in 5 accounts had absolutely zero activity during this period – no deposits, withdrawals, purchases, exchanges or any other activity. That level of dormancy in an account is actually remarkable, so I take it as an extreme lower bound on the “did nothing” level. If that “did nothing” level included people who had automatic deposits, automatic withdrawals and other ‘non-market motivated’ activity, I believe it would be much larger than 1 in 5 accounts.
Reactions are diverse
Trading generally requires lots of people on both sides of the trade. While I definitely tend to see more activity during a drop, there’s nuance in the balance: it depends on the clients in the data.
Who buys?
Clients with extra cash and no need to use their investment money soon will tend to be motivated to buy. These clients tend to be younger (longer time horizons) and higher earning. Also, clients who have been through a few dips and come out the other side will be bolder.
Who sells?
Clients who have shorter time horizons, less buffer to their finances (including near-retirees) and larger invested balances tend to want to de-risk. Sellers also tend to be people who pay too much attention to markets and moving averages.
Does it matter?
The graph below depicts the relative-to-benchmark returns for various Vanguard IRA accounts. A first thing to note is that there is variance on both sides: underperformance and outperformance. There is a slight tendency to underperform, in part driven by people who were invested in cash over the entire period. These people didn’t react to the market drop – they were just never invested in the first place. (the spike at -5.5%).
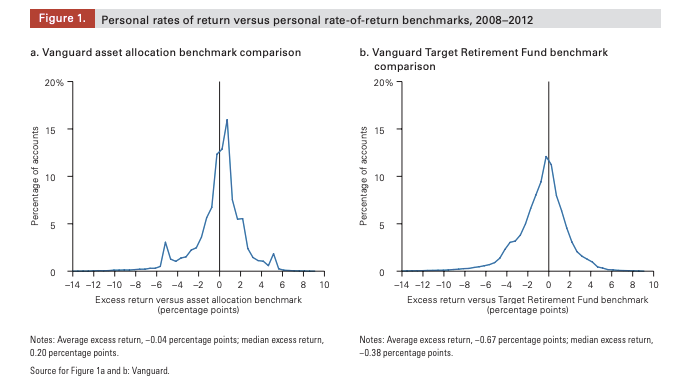
This graph is broadly representative of what I tend to see: there is variation in outcomes, but no strong systematic downward bias, especially not specifically due to market-timing. Investors do various things: They may sit in cash for a long time, hold under-diversified portfolios, or home bias their holdings. These actions cause variation in their outcomes, but broad-based market-timing doesn’t necessarily seem like a huge factor.
Overall, individual investors continued to trade actively and did not de-risk their investment portfolios during the crisis. source
The minority import
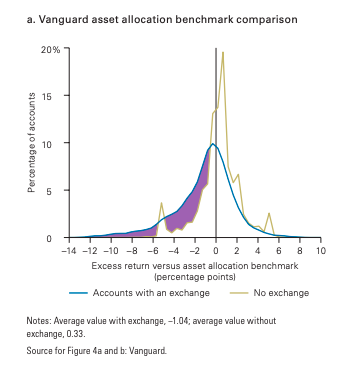
Another detail revealed in the Vanguard study is that while a minority of investors underperform due to market-timing, when they do their underperformance is disproportionately large. This minority drags down the average significantly, a bit like a billionaire massively skews the average wealth in a room upwards.
This also hints at a really important take-away: For the subset of people who are prone to panic trading during a drawdown, paying someone to help weather the storm can be very, very valuable.
Caveat Lector
The document I’ve made the most of above is the Vanguard event study. It should be noted that Vanguard accounts are not representative either – they tend to be stay-the-course investors who don’t trade and hold concentrated portfolios. Most other data would likely show more activity, so we can assume that investors may be more active than this Vanguard study suggests. How much more? I don’t know.
On the other hand, these are IRA accounts, and many people have much of their investments in target date funds in 401(k)s, which are even less active than IRAs. Where does the balance lie? I don’t know.
Sometimes we say “investors” when we mean “dollars.” Just two investors trading while everyone else sits on the sideline. Given the power law of wealth distribution, markets can be wildly volatile even while most people are utterly inactive. The marginal active dollar in most markets is not your uncle and aunt. So markets can move even though most investors are inactive.
Anyway….
One of the under-appreciated findings of the landmark paper Trading is Hazardous to your Wealth is that before costs are taken into account, individual investors didn’t underperform on average. The underperformance of those brokerage accounts was driven by costs like commissions, bid-ask spreads and taxes. Since modern investors’ transaction costs are near zero, we can expect to see higher variance in outcomes (as people over-trade more and drift further from the benchmark), but lower average underperformance.
Yet, if a fool and his money are soon parted, so are bad investors and their dollars. Over time, money accumulates to those who are good at not losing it. That might be through inaction and apathy, but it counts, too.
References
Most Vanguard Investors shot part by staying the course
Trading is Hazardous to your Wealth
Who drove and burst the tech bubble?
Individual Investor Perceptions and Behavior During the Financial Crisis